
The finished map should answer three questions: where the indicator is high, how strongly cities differ, and which cities have no data. The values below are simulated for demonstration only.
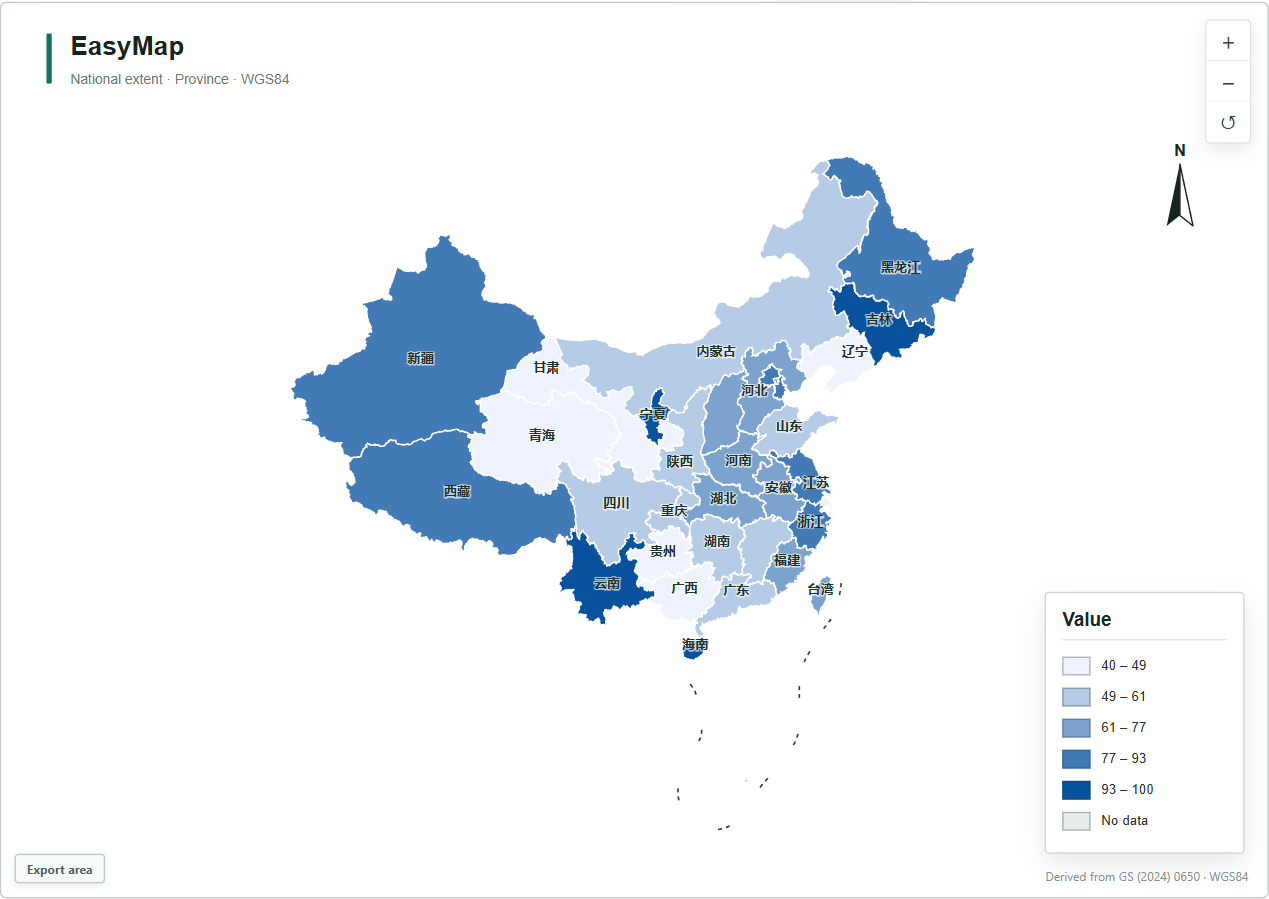
1. Select Guangdong at the city level
Choose Detailed China Map, select City, and filter the province to Guangdong Province. EasyMap initially selects the cities under Guangdong. You may remove cities you do not need while keeping the display extent at the province level for geographic context.
2. Prepare and paste city data
Place name	Indicator
广州市	126
深圳市	148
珠海市	82
佛山市	117
惠州市	76
东莞市	109
中山市	91
A short input such as “广州” can usually match “广州市”, but complete official names are safer in formal data. Review every match and make sure no district or county rows were mixed into the city-level table.
3. Set classes and colors
Try natural breaks when the city values are skewed. Use quantiles when each color should contain a similar number of cities. Five classes are a practical starting point for one province. Sequential ramps fit ordered indicators, while diverging ramps need a meaningful midpoint.
4. Handle Pearl River Delta labels
Guangzhou, Foshan, Dongguan, Shenzhen, Zhongshan, and Zhuhai sit close together. EasyMap keeps detailed administrative labels at their representative points; it does not move a label into another city or silently remove it. When the area is dense, reduce value labels, lower the font size slightly, or enlarge the map frame.
Areas without data can keep a light-gray fill and lower-contrast place names. Cities with values remain visually prominent.
5. Finish the title, unit, and legend
The title should identify both place and indicator, such as “City Indicator Distribution in Guangdong”. Use the subtitle for year, level, or methodology. A unit appears in the legend title rather than after every map label. Drag the legend away from the Pearl River Delta and coastline.
6. Export for a presentation
PNG works for ordinary slides. Choose SVG when text and linework need further editing in vector software. A 16:9 frame fits widescreen presentations; landscape A4 fits reports. Check that title, map, legend, and labels all remain inside the export frame.
Extend the same dataset
The same city data can become proportional bubbles or map bars. For movement between cities, switch to a flow map and prepare origin, destination, and value columns.
Authoritative sources and further reading
- Official Standard Map ServicePublisher:Standard Map Service
- Specification for the Presentation of Public Map ContentPublisher:Ministry of Natural Resources
Build your Guangdong map
Test five to seven cities first, then paste the complete dataset once the scope and style are correct.
Open EasyMap →